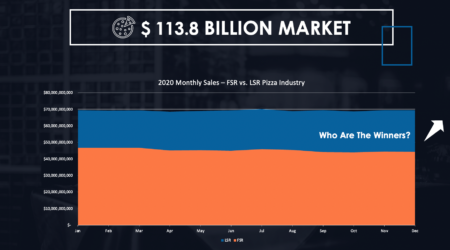
Pizza Market in the US
The pizza market is a huge billion dollar market, and overall the market is decreasing. If we start looking into our Pizza Database in more detail, we see that the total market is decreasing, but certain part are still increasing.
This is why we will discover together that making a simple analysis based on 4 criterias will enable you to go after the 28,000 most promising Pizza Operators.
Let’s have a deep-dive into the pizza market.
Which pizza segment is outperforming the pizza market?
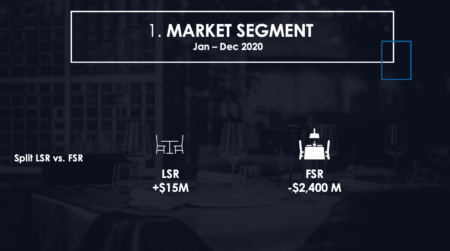
Looking at the Full Service Restaurants (FSR), all subsegments show a loss in 2020. These 4 subsegments are:
- 2110. FSR – CAFÉ-RESTAURANTS, FAMILY-STYLE, DINER
- 2120. FSR – TRADITIONAL RESTAURANTS, CASUAL DINING
- 2130. FSR – UPSCALE CASUAL DINING RESTAURANTS
- 2140. FSR – FINE DINING RESTAURANTS
In comparison with the Limited Service Restaurants (LSR) we see that certain sub parts are showing an increase.
Within the LSR market, we have 3 main subcategories:
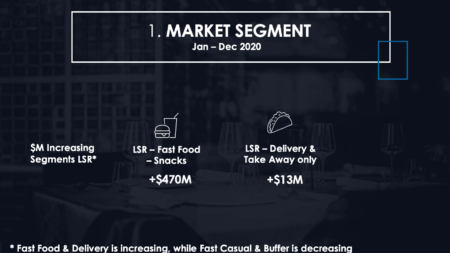
- 2310. LSR – QUICK SERVICE RESTAURANTS, FAST FOOD, SNACKS, is the biggest categorie, accounting for 57% of all pizza sales. This categorie shows a growth in 2020 of 1%.
- 2320. LSR – FAST CASUAL, a category worth 3% of the total pizza sales, shows a small decrease
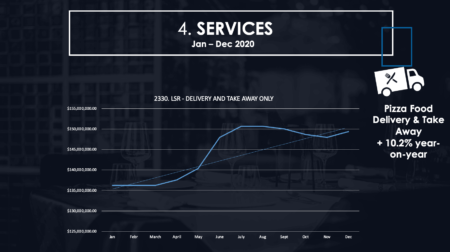
- 2330. LSR – DELIVERY AND TAKE AWAY ONLY, still a small category representing 1% of total pizza sales, but with an increase of 10% growth in 2020.
Certain parts of the pizza market are increasing. Let’s deep-dive further in this LSR segment.
Looking at the LSR segment, we want to see whether the chains (a store who has 10+ units) or the independents are growing or declining.
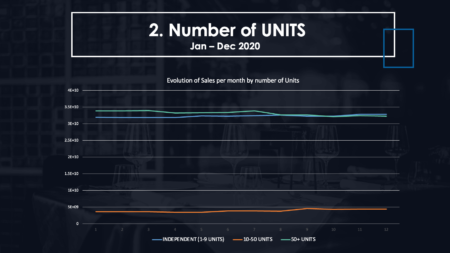
In our pizza database we make the split between chain and independent based on numbers of units. When going into detail on the pizza LSR market, we will make exceptionally a difference between the next three segments:
- INDEPENDENTS (<10 units), representing a total of 47% of the total pizza sales market, This is the segment that is growing with 3% in 2020.
- CHAIN (10-50 units), representing a total of 6%, an increasing sub market
- CHAIN (50+ units), representing a total of 46% of the total pizza sales market. This market is decreasing with 5%.
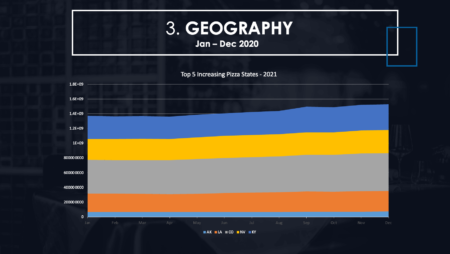
Our pizza database shows us that the LSR – Independents are showing an increase. Looking now at the states, we see that the highest increase comes from the next 5 states, with an average annual increase of around 11% in 2020:
- Arkansas
- Los Angelos
- Colorado
- Nevada
- Kentucky
There is an ideal type of Pizza operator you should go after in this pandemic.
These are operators with that offer delivery & take out services, part of middle chains 10-50 units, based in specific geographies, in the LSR market segment.
GOOD NEWS: At CHD, we’ve already identified them for you. If you are interested to get a sample or a bigger pool of real leads to go after, all you need is to put your e-mail address in the chat.