The Insatiable Appetite for Mexican Food in the U.S.
The craving for Mexican food and beverages continues to increase in the United States. In 2017, we counted more than 59,800 Mexican restaurants. Today we are counting almost 65,000 restaurants with Mexican as a Menu item.
The continued increase of the Hispanic population in the United States, led by Mexicans, has allowed the taste for Mexican cuisine to expand in a surprising way throughout the United States.
MEXICAN FOOD CONSUMPTION STATISTICS
In 2020, Mexico will remain the third-largest menu trend for the United States, or around 7% of the country’s foodservice market.
“From small taquerias with a loyal local customer base, to the chains with addicted millennial customers, our nation’s Mexican restaurants are a deep well of demand for businesses who want to sell more into this menu type.” said Jolien Demeyer, Global Marketing Director of CHD Expert. “Many distributors and suppliers have niche products focused towards restaurants that serve Mexican food, and it is important for them to understand their sales potential and where opportunities lie within this lucrative menu type.”
As of September 2020, there are around 65,000 Mexican restaurants in the United States and the Mexican Menu Type represents approximately 7 percent of all restaurants in the USA.
Broken down by segment, 53 percent of Mexican restaurants are Full Service Restaurants and 47 percent are Limited Service Restaurants. By definition FSRs operate with a wait staff and offer table service, while LSRs require food to be purchased at a counter and paid for before food is served.
Breaking these LSR operators down:
- Taco Bell makes up 38 percent of all LSR Mexican Chain restaurants.
- The other most prevalent Mexican chains are Chipotle Mexican Grill (16%),
- Qdoba Mexican Grill (4%),
- Moe’s Southwest Grill (4%),
- and Del Taco (3%).
Within the FSR market segment,
- 85 percent of the restaurants fall within the Casual Dining category,
- followed by Family Style (12%),
- Upscale Dining (3%),
- and Fine Dining (less than 1%).
- Chuy’s and On The Border represent two of the larger Mexican FSR chains.
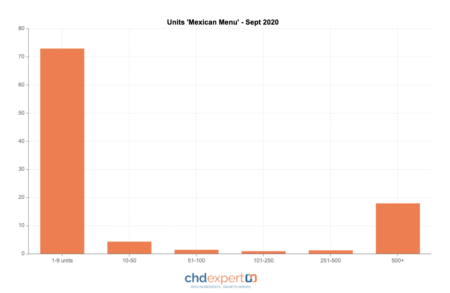
Another interesting fact about the Mexican Restaurant Industry is that it is dominated by independent restaurants; approximately 73 percent of the nation’s Mexican restaurants are independent. CHD Expert defines a chain as having 10 or more units in operation, while an independent restaurant will have less than 9.
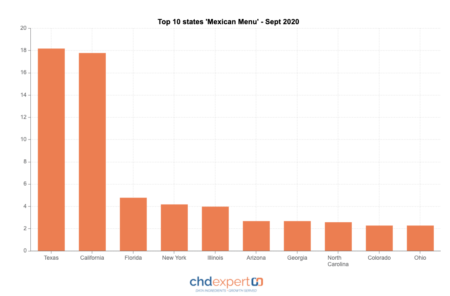
Geographically speaking, it’s no surprise that the state of Texas is el jefe in terms of total Mexican restaurants within its state lines, with 18 percent of the state’s total restaurants being of the Mexican Menu Type. California is the biggest climber who is also representing 18 percent of the Mexican Menu Type.
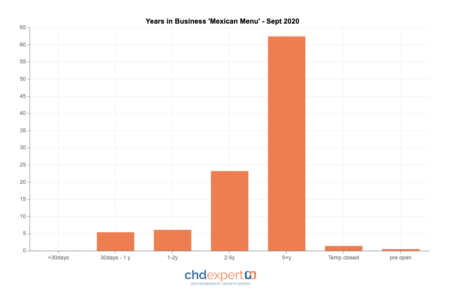
The Mexican operators are very loyal. Most of them are 5+ years in business. An interesting find is that 1% is still opening their business.
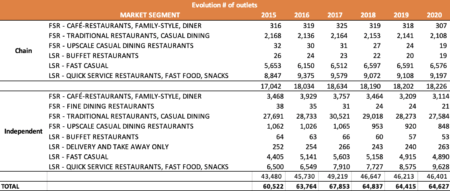
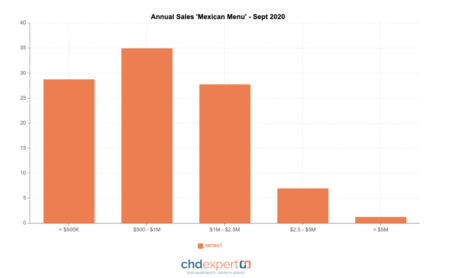
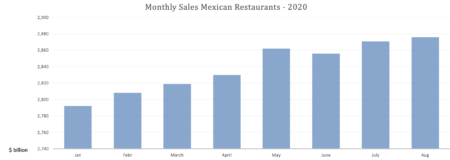
What is interesting is, that this market segment increased their sales during the pandemic. See below figures to see the evolution in 2020. Mainly the LSR / QSR are the winners here. The Mexican market segment counts for around $2,876 billion in Aug 2020.
Looking at the evolution of the # outlets, we can state that:
- More independents are opening op vs. chains
- LSR accounts for 47%, and is performing much better vs. the LSR